NASDAQ-100
| NASDAQ-100 | ||
|---|---|---|
| ||
| Oprichting | 1985 | |
| Beurs | NASDAQ | |
| Locatie | New York, | |
| Fondsenaantal | 101 | |
| Soort | nationale index | |
| Methode | marktwaarde gewogen | |
| Hoofdfondsen | Microsoft, Intel, Apple Inc | |
| Website | NASDAQ-100 Index | |
De NASDAQ-100 is de index met de 100 meest verhandelde niet-financiële ondernemingen op de NASDAQ.
In september 2023 bestond de index uit 101 aandelen. Informatietechnologie is de grootste sector met een aandeel van 57% op 29 september 2023. De tweede sector is duurzame consumptiegoederen met een aandeel van 19%. Het bedrijf met het grootste gewicht van 11% is Apple Inc., gevolgd door Microsoft (9,5%) en Amazon.com (5,3%).[1]
Hoewel de aandelenindex met alle ondernemingen van deze beurs bekender is in de media, de NASDAQ Composite, vindt de echte handel in opties, futures en exchange-traded funds voornamelijk plaats in de NASDAQ-100 Index.
De ETF op deze index is het meest verhandelde aandeel van de Verenigde Staten, de NASDAQ: QQQ, ook wel bekend als de Cubes.
Samenstelling
Deze ondernemingen zijn onderdeel van de NASDAQ op peildatum 1 augustus 2024. Een actuele lijst is beschikbaar via de Externe link sectie.
| Bedrijfsnaam | Ticker |
|---|---|
| Adobe Inc. | ADBE |
| Advanced Micro Devices | AMD |
| Airbnb | ABNB |
| Alphabet Inc. (Class A) | GOOGL |
| Alphabet Inc. (Class C) | GOOG |
| Amazon.com, Inc. | AMZN |
| American Electric Power | AEP |
| Amgen Inc. | AMGN |
| Analog Devices | ADI |
| Ansys Inc. | ANSS |
| Apple Inc. | AAPL |
| Applied Materials, Inc. | AMAT |
| ARM Holdings | ARM |
| ASML Holding | ASML |
| AstraZeneca | AZN |
| Atlassian | TEAM |
| Autodesk, Inc. | ADSK |
| Automatic Data Processing, Inc. | ADP |
| Baker Hughes | BKR |
| Biogen, Inc | BIIB |
| Booking Holdings | BKNG |
| Broadcom Inc. | AVGO |
| Cadence Design Systems, Inc. | CDNS |
| CDW Corporation | CDW |
| Charter Communications, Inc. | CHTR |
| Cintas Corporation | CTAS |
| Cisco Systems, Inc. | CSCO |
| Cola Cola EuroPacific | CCEP |
| Cognizant Technology Solutions Corporation | CTSH |
| Comcast Corporation | CMCSA |
| Constellation Energy | CEG |
| Copart | CPRT |
| Costar Group | CSGP |
| Costco Wholesale Corporation | COST |
| CrowdStrike | CRWD |
| CSX Corporation | CSX |
| Datadog | DDOG |
| DEXCOM | DXCM |
| Diamondback Energy | FANG |
| Dollar Tree, Inc. | DLTR |
| Doordash | DASH |
| Electronic Arts | EA |
| Exelon Corp | EXC |
| Fastenal Company | FAST |
| Fortinet | FTNT |
| GE HealthCare | GEHC |
| Gilead Sciences, Inc. | GILD |
| GlobalFoundries | GFS |
| Honeywell | HON |
| IDEXX Laboratories, Inc. | IDXX |
| Illumina, Inc. | ILMN |
| Intel Corporation | INTC |
| Intuit, Inc. | INTU |
| Intuitive Surgical Inc. | ISRG |
| Keurig Dr Pepper Inc. | KDP |
| KLA Corporation | KLAC |
| Kraft Heinz Company | KHC |
| Lam Research, Inc. | LRCX |
| Linde Group | LIN |
| Lululemon athletica | LULU |
| Marriott International, Inc. | MAR |
| Marvell Technology Group | MRVL |
| MercadoLibre | MELI |
| Meta Platforms | META |
| Microchip Technology | MCHP |
| Micron Technology | MU |
| Microsoft Corporation | MSFT |
| Moderna | MRNA |
| Mondelēz International | MDLZ |
| Mongodb | MDB |
| Monster Beverage | MNST |
| Netflix | NFLX |
| NVIDIA Corporation | NVDA |
| NXP Semiconductors | NXPI |
| Old Dominion Freight | ODFL |
| ON Semiconductor | ON |
| O'Reilly Automotive, Inc. | ORLY |
| PACCAR Inc. | PCAR |
| Palo Alto Networks | PANW |
| Paychex, Inc. | PAYX |
| PayPal Holdings, Inc. | PYPL |
| PDD Holdings | PDD |
| PepsiCo, Inc. | PEP |
| QUALCOMM Incorporated | QCOM |
| Regeneron Pharmaceuticals | REGN |
| Roper Technology | ROP |
| Ross Stores Inc. | ROST |
| Starbucks Corporation | SBUX |
| Super Micro Computer | SMCI |
| Synopsys, Inc. | SNPS |
| Take-Two Interactive, Inc. | TTWO |
| Tesla, Inc. | TSLA |
| Texas Instruments, Inc. | TXN |
| The Trade Desk | TTD |
| T-Mobile US | MTUS |
| Verisk Analytics | VRSK |
| Vertex Pharmaceuticals | VRTX |
| Workday | WDAY |
| Warner Brothers | WBD |
| Xcel Energy, Inc. | XEL |
| ZScaler, Inc. | ZS |
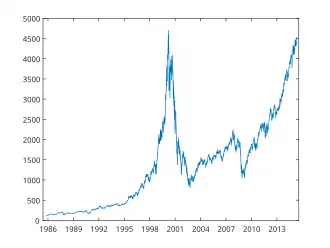
Koersverloop
In de tabel staat het koersverloop van de NASDAQ-100 vanaf 1985. De koersen zijn per jaarulimo.
| Jaar | Eindstand in punten |
Mutatie in punten |
Idem in % |
|---|---|---|---|
| 1985 | 132,29 | ||
| 1986 | 141,41 | 9,12 | 6,89 |
| 1987 | 156,25 | 14,84 | 10,49 |
| 1988 | 177,41 | 21,16 | 13,54 |
| 1989 | 223,84 | 46,43 | 26,17 |
| 1990 | 200,53 | −23,31 | −10,41 |
| 1991 | 330,86 | 130,33 | 64,99 |
| 1992 | 360,19 | 29,33 | 8,86 |
| 1993 | 398,28 | 38,09 | 10,57 |
| 1994 | 404,27 | 5,99 | 1,50 |
| 1995 | 576,23 | 171,96 | 42,54 |
| 1996 | 821,36 | 245,13 | 42,54 |
| 1997 | 990,80 | 169,44 | 20,63 |
| 1998 | 1.836,01 | 845,21 | 85,31 |
| 1999 | 3.707,83 | 1.871,81 | 101,95 |
| 2000 | 2.341,70 | −1.366,13 | −36,84 |
| 2001 | 1.577,05 | −764,65 | −32,65 |
| 2002 | 984,36 | −592,69 | −37,58 |
| 2003 | 1.467,92 | 483,56 | 49,12 |
| 2004 | 1.621,12 | 153,20 | 10,44 |
| 2005 | 1.645,20 | 24,08 | 1,49 |
| 2006 | 1.756,90 | 111,70 | 6,79 |
| 2007 | 2.084,93 | 328,03 | 18,67 |
| 2008 | 1.211,65 | −873,28 | −41,89 |
| 2009 | 1.860,31 | 648,66 | 53,54 |
| 2010 | 2.217,86 | 357,55 | 19,22 |
| 2011 | 2.277,83 | 59,97 | 2,70 |
| 2012 | 2.660,93 | 383,10 | 16,82 |
| 2013 | 3.592,00 | 931,07 | 34,99 |
| 2014 | 4.236,28 | 644,28 | 17,94 |
| 2015 | 4.593,27 | 356,99 | 8,43 |
| 2016 | 4.863,62 | 270,35 | 5,89 |
| 2017 | 6.396,42 | 1.532,80 | 31,52 |
| 2018 | 6.329,96 | −66,46 | −1,04 |
| 2019 | 8.733,07 | 2.403,11 | 37,96 |
| 2020 | 12.888,28 | 4.155,21 | 47,58 |
| 2021 | 16.320,08 | 3.431,80 | 26,63 |
| 2022 | 10.939,76 | −5.380,32 | −32,97 |
| 2023 | 16.825,93 | 5.886,17 | 53,81 |
Zie ook
Externe link
- (en) NASDAQ-100 website met koersverloop, samenstelling etc.
- ↑ (en) NASDAQ NASDAQ-100 Index factsheet, september 2023, geraadpleegd op 25 december 2023