Lijst van landen naar staalproductie
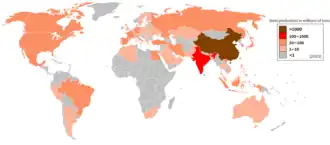
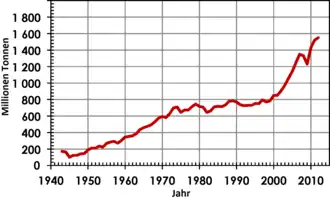
Volgend is een lijst van landen geordend op hun jaarlijkse ruwstaalproductie in metrische ton. De gegevens komen van het International Iron and Steel Institute.
Lijst
| Land | Productie (t × miljoen) | ||
|---|---|---|---|
| 2006[1] | 2013[2] | 2020[3] | |
| wereld | 1244,2 | 1606 | 1877,5 |
| 422,7 | 779 | 1064,8 | |
| 44 | 81,2 | 100,3 | |
| 116,2 | 110,6 | 83,2 | |
| 98,6 | 86,9 | 72,7 | |
| 70,8 | 68,7 | 71,6 | |
| 48,5 | 66,1 | 67,1 | |
| 23,3 | 34,7 | 35,8 | |
| 47,2 | 42,6 | 35,7 | |
| 30,9 | 34,2 | 31 | |
| 9,8 | 15,4 | 29 | |
| 20,2 | 22,3 | 21 | |
| 40,9 | 32,8 | 20,6 | |
| 31,6 | 24,1 | 20,4 | |
| 5,6 | 19,5 | ||
| 16,3 | 18,2 | 16,8 | |
| 19,9 | 15,7 | 11,6 | |
| 18,4 | 13,8 | 11 | |
| 15,4 | 12,4 | 11 | |
| 3,8 | 2,4 | 9,3 | |
| 6 | 6,8 | 8,2 | |
| 10 | 8 | 7,9 | |
| 4 | 5,5 | 7,8 | |
| 5,5 | 5,9 | 7,1 | |
| 13,9 | 11,9 | 7,1 | |
| 7,1 | 8 | 6,8 | |
| 11,6 | 7,1 | 6,1 | |
| 6,4 | 6,7 | 6,1 | |
| 5,5 | |||
| 7,9 | 4,7 | 5,5 | |
| 6,9 | 5,2 | 4,5 | |
| 5,4 | 3,5 | 4,5 | |
| 5,5 | 4,4 | 4,4 | |
| 4 | |||
| 4,2 | 3,3 | 3,9 | |
| 9,7 | 7,2 | 3,9 | |
| 3,8 | |||
| 5,5 | 5,2 | 3,7 | |
| 5,1 | 3,5 | 3,5 | |
| 5,1 | 4,5 | 3,4 | |
| 6,3 | 3 | 2,8 | |
| 2,9 | 2,7 | ||
| 2,3 | 2,2 | 2,5 | |
| 2,1 | 2,2 | ||
| 2 | |||
| 1,3 | 1,9 | ||
| 2,8 | 2,1 | 1,9 | |
| 1,5 | |||
| 2,4 | 1 | 1,4 | |
| 1,3 | |||
| 2,1 | 0,9 | 1 | |
| 2,2 | 0,8 | ||
| 2,1 | 0,5 | 0,5 | |
| 4,9 | 2,1 | 0 | |
| 1,5 | |||
| 1,3 | |||
| 1,2 | |||
| 1,1 | |||
Zie ook
Bronnen, noten en/of referenties
- ↑ (en) World Steel in figures 2007. World Steel Association (4 september 2007). Gearchiveerd op 28 juli 2022. Geraadpleegd op 28 juli 2022.
- ↑ (en) World Steel in figures 2014. World Steel Association (2014). Gearchiveerd op 8 oktober 2022. Geraadpleegd op 8 oktober 2022.
- ↑ (en) World Steel in figures 2021. World Steel Association (2021). Gearchiveerd op 8 oktober 2022. Geraadpleegd op 8 oktober 2022.