Florenville
| Stad in België | |||
|---|---|---|---|
 | |||
 | |||
| Geografie | |||
| Gewest | |||
| Provincie | |||
| Arrondissement | Virton | ||
| Oppervlakte – Onbebouwd – Woongebied – Andere |
148,07 km² (2023) 92,74% 1,49% 5,77% | ||
| Coördinaten | 49° 42' NB, 5° 19' OL | ||
| Bevolking (bron: Statbel) | |||
| Inwoners – Mannen – Vrouwen – Bevolkingsdichtheid |
5.705 (01/01/2025) 48,71% 51,29% 38,53 inw./km² | ||
| Leeftijdsopbouw – 0-17 jaar – 18-64 jaar – 65 jaar en ouder |
(01/01/2025) 17,95% 54,86% 27,19% | ||
| Buitenlanders | 5,82% (01/01/2025) | ||
| Politiek en bestuur | |||
| Burgemeester | Camille Maitrejean | ||
| Bestuur | Florenville Les Engagés, AC | ||
| Zetels Florenville Les Engagés AC Vivr'Ensemble |
17 8 6 3 | ||
| Economie | |||
| Gemiddeld inkomen | 19.561 euro/inw. (2022) | ||
| Werkloosheidsgraad | 10,72% (jan. 2019) | ||
| Overige informatie | |||
| Postcode 6820 6820 6820 6820 6821 6823 6824 |
Deelgemeente Florenville Fontenoille Muno Sainte-Cécile Lacuisine Villers-devant-Orval Chassepierre | ||
| Zonenummer | 061 | ||
| NIS-code | 85011 | ||
| Politiezone | De Gaume | ||
| Hulpverleningszone | Luxemburg | ||
| Website | www | ||
| Detailkaart | |||
| |||
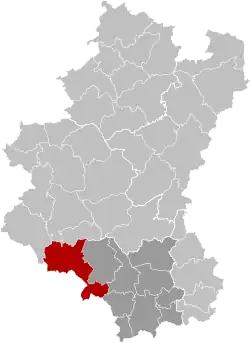
| ligging binnen het arrondissement Virton in de provincie Luxemburg | |||
| |||
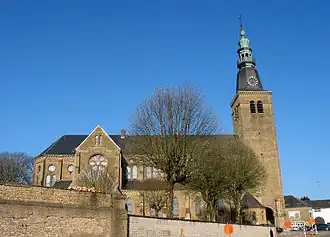
Florenville (Gaumais: Floravile) is een stad en plaats in de Provincie Luxemburg in België. De gemeente telt zo'n 5500 inwoners. Florenville ligt op een cuesta, die gevormd is door kalkhoudende zandsteen van Florenville.
Kernen
Deelgemeenten
| # | Naam | Opp. (km²) |
Inwoners (2020) |
Inwoners per km² |
NIS-code |
|---|---|---|---|---|---|
| 1 | Florenville | 17,14 | 2.548 | 149 | 85011A |
| 2 | Villers-devant-Orval | 31,67 | 533 | 17 | 85011B |
| 3 | Chassepierre | 14,94 | 433 | 29 | 85011C |
| 4 | Lacuisine | 25,40 | 684 | 27 | 85011D |
| 5 | Fontenoille | 7,65 | 272 | 36 | 85011E |
| 6 | Sainte-Cécile | 21,09 | 477 | 23 | 85011F |
| 7 | Muno | 30,21 | 647 | 21 | 85011G |
Overige kernen
Demografische evolutie
Demografische evolutie voor de fusie
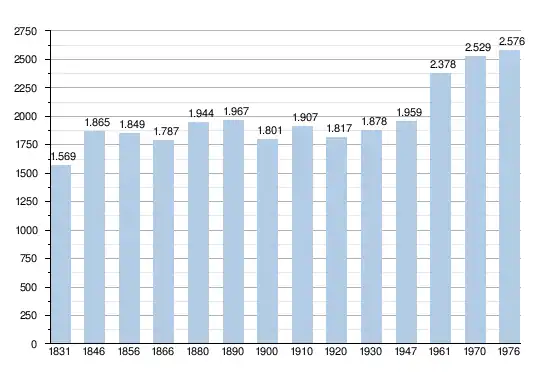
- Bronnen:NIS, Opm:1831 tot en met 1970=volkstellingen
Demografische evolutie van de fusiegemeente
Alle historische gegevens hebben betrekking op de huidige gemeente, inclusief deelgemeenten, zoals ontstaan na de fusie van 1 januari 1977.
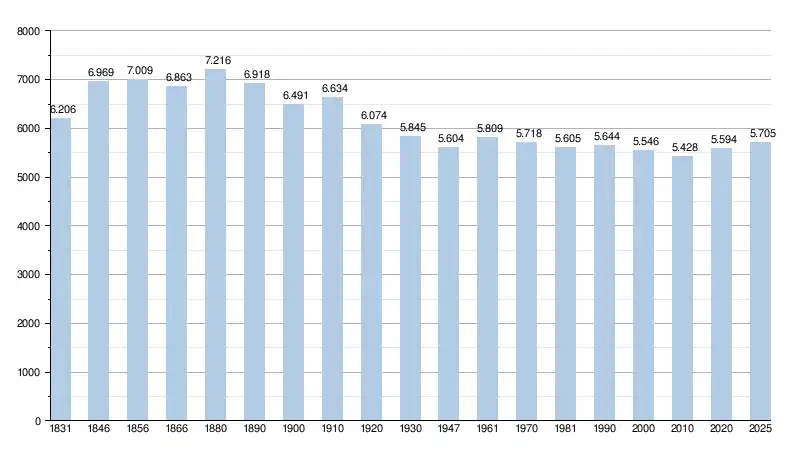
- Bronnen:NIS, Opm:1831 tot en met 1981=volkstellingen; 1990 en later= inwonertal op 1 januari
| Inwoners van jaar tot jaar op 1 januari 1992 tot heden | ||
|---|---|---|
| jaar | Aantal[1] | Evolutie: 1992=index 100 |
| 1992 | 5.722 | 100,0 |
| 1993 | 5.733 | 100,2 |
| 1994 | 5.697 | 99,6 |
| 1995 | 5.716 | 99,9 |
| 1996 | 5.684 | 99,3 |
| 1997 | 5.626 | 98,3 |
| 1998 | 5.625 | 98,3 |
| 1999 | 5.600 | 97,9 |
| 2000 | 5.546 | 96,9 |
| 2001 | 5.510 | 96,3 |
| 2002 | 5.504 | 96,2 |
| 2003 | 5.491 | 96,3 |
| 2004 | 5.494 | 96,0 |
| 2005 | 5.532 | 96,7 |
| 2006 | 5.449 | 95,2 |
| 2007 | 5.448 | 95,2 |
| 2008 | 5.446 | 95,2 |
| 2009 | 5.464 | 95,5 |
| 2010 | 5.428 | 94,9 |
| 2011 | 5.483 | 95,8 |
| 2012 | 5.512 | 96,3 |
| 2013 | 5.527 | 96,6 |
| 2014 | 5.542 | 96,9 |
| 2015 | 5.566 | 97,3 |
| 2016 | 5.632 | 98,4 |
| 2017 | 5.628 | 98,4 |
| 2018 | 5.629 | 98,4 |
| 2019 | 5.578 | 97,5 |
| 2020 | 5.594 | 97,8 |
| 2021 | 5.687 | 99,4 |
| 2022 | 5.765 | 100,8 |
| 2023 | 5.838 | 102,0 |
| 2024 | 5.787 | 101,1 |
| 2025 | 5.705 | 99,7 |
Resultaten gemeenteraadsverkiezingen sinds 1976
| Partij | 10-10-1976[2] | 10-10-1982 | 9-10-1988 | 9-10-1994 | 8-10-2000 | 8-10-2006[3] | 14-10-2012[4] | 14-10-2018 | 13-10-2024 | |||||||||
|---|---|---|---|---|---|---|---|---|---|---|---|---|---|---|---|---|---|---|
| Stemmen / Zetels | % | 17 | % | 17 | % | 17 | % | 17 | % | 17 | % | 17 | % | 17 | % | 17 | % | 17 |
| ECOLO | - | - | - | - | - | 6,21 | 0 | 7,83 | 0 | - | - | |||||||
| NGC1 / ESP2 / NE.Com3 / E.A.4 / Agir Pour Vous5 / C.U.P.6 / Florenville Les Engagés7 | 58,541 | 11 | 41,11 | 7 | 44,781 | 9 | 43,482 | 8 | 38,573 | 7 | 39,594 | 7 | 34,035 | 6 | 34,826 | 6 | 39,587 | 8 |
| Int Com | 1,63 | 0 | - | - | - | - | - | - | - | - | ||||||||
| PR | 4,93 | 0 | - | - | - | - | - | - | - | - | ||||||||
| UDGF | 34,9 | 6 | - | - | - | - | - | - | - | - | ||||||||
| GS | - | 29,57 | 5 | 17,58 | 3 | - | - | - | - | - | - | |||||||
| E.C.F.1 / EC2 / Vivr'Ensemble3 | - | 28,341 | 5 | 21,162 | 3 | 20,991 | 3 | 23,661 | 4 | 17,781 | 3 | 26,543 | 5 | 29,973 | 5 | 20,923 | 3 | |
| UDB | - | 0,99 | 0 | - | - | - | - | - | - | - | ||||||||
| ENTITE | - | - | 16,48 | 2 | - | - | - | - | - | - | ||||||||
| O.P.A.1 / TSV2 / AC3 | - | - | - | 35,531 | 6 | 37,771 | 6 | 36,421 | 7 | 31,592 | 6 | 35,223 | 6 | 32,783 | 6 | |||
| Totaal stemmen | 3904 | 3936 | 3909 | 3955 | 3795 | 3894 | 3789 | 3897 | 3864 | |||||||||
| Opkomst % | 93,81 | 93,52 | 91,73 | 93,18 | 89,32 | 89,94 | 86,46 | |||||||||||
| Blanco en ongeldig % | 2,82 | 2,57 | 4,25 | 5,56 | 8,67 | 7,83 | 7,02 | 10,01 | 10,30 | |||||||||
Zie ook
Externe link
Bronnen, noten en/of referenties
- ↑ https://view.officeapps.live.com/op/view.aspx?src=https%3A%2F%2Fstatbel.fgov.be%2Fsites%2Fdefault%2Ffiles%2Ffiles%2Fdocuments%2Fbevolking%2F5.1%2520Structuur%2520van%2520de%2520bevolking%2FBevolking_per_gemeente.xlsx&wdOrigin=BROWSELINK
- ↑ 1976-2000:Verkiezingsdatabase Binnenlandse Zaken. Gearchiveerd op 10 januari 2022.
- ↑ Gegevens 2006: elections2006.wallonie.be:. Gearchiveerd op 9 januari 2018. Geraadpleegd op 31 december 2012.
- ↑ Gegevens 2012: elections2012.wallonie.be
Zie de categorie Florenville van Wikimedia Commons voor mediabestanden over dit onderwerp.